| My Interview About Community Organizing | The Oil Drum: Local | Spitzer Promotes Clean Energy, Minus Ethanol |
The City's Office of Sustainability has released the first ever inventory of NYC's carbon emissions (PDF), which in the baseline year of 2005, was 58.3 million metric tons of CO2 equivalent. The three main sources by use were Heating, Electric and Combustion vehicles. If unchecked, Carbon Emissions are expected to increase dramatically to 73.9 million metric tons of carbon equivalent by 2030.
The report also breaks down the carbon emissions by sector (Residential, Commercial, Vehicles) and source (Electricity, Gasoline, Natural Gas, Heating Fuel Oil).
I've just started reading though the report, but already I find it a compelling analysis of a specific geography's contribution to global warming. It has significant limitations of scope though. It does not account for the goods produced for NYC, in particular the food produced to feed residents, virtually none of which is produced within the 5 boroughs. It would be a great next step to estimate the impact of the manufacturing and agricultural sectors that support the city.
There is a section that includes aviation and shipping into the estimates of NYC's carbon emissions, but they do not include that in the grand total for the City, but recognize that they are something the city does have control over.

One point the report makes very clear is how New York is already far ahead of other American cities because of its dense multi-unit living spaces, its walkability and high rate of mass transit ridership. New York emits only 1/3 the carbon per capita as the average American. This shows the absolute advantage of urban areas over the suburbs in greenhouse gas emissions.
Now that the City has captured this data, it should continue to track this over time and include this in the City's performance reports. For policy makers this should put added pressure to increase efforts to promote green buildings and alternative modes of transportation.
Personnel
Classic posts
Archives
- November 2008 (1)
- August 2008 (1)
- July 2008 (4)
- June 2008 (4)
- May 2008 (3)
- April 2008 (1)
- March 2008 (1)
- February 2008 (2)
- January 2008 (2)
- December 2007 (4)
- November 2007 (4)
- October 2007 (6)
The Oil Drum: New York City archives
- September 2007 (3)
- August 2007 (2)
- July 2007 (3)
- June 2007 (8)
- May 2007 (1)
- April 2007 (8)
- March 2007 (2)
- February 2007 (3)
- January 2007 (5)
- December 2006 (5)
- November 2006 (12)
- October 2006 (10)
- September 2006 (9)
- August 2006 (14)
- July 2006 (15)
- June 2006 (11)
- May 2006 (18)
- April 2006 (35)
- March 2006 (14)
- February 2006 (13)
- January 2006 (12)
- December 2005 (17)
- November 2005 (13)
- October 2005 (25)
- September 2005 (36)
License

This work is licensed under a Creative Commons Attribution-Share Alike 3.0 United States License.
Glenn,
Thanks for posting on this report. I found it interesting that NYC chose to address "electricity" as a GHG source without going into any significant detail about what it actually represents. Appendix A is a lengthy discussion of how they aggregated the GHG contribution from electricity production without really saying what the breakdown is between coal, NG, oil, nuclear, hydro, etc. I think it would have been helpful if the report included a chart that showed the GHG emissions based on the source. For example, take Figure 6 and breakdown the fuels used to produce electricity and put them in the exisiting categories (create the new ones as necessary). How else to show how dependent NYC is on natural gas vs. nuclear or coal?
Also, this aside at the end of Appendix A warrants some attention:
Finally, it is important to single out the assumption that nuclear power is emissions free. Indian Point light water reactor is a significant source of electricity for New York City. Counting this source as having zero emissions has a sizable impact on the coefficient and on the entire city’s profile. While it is undisputed that there are no carbon dioxide emissions generated during the fission reaction itself, there is a significant amount of energy utilized in the mining, processing and enrichment of the uranium fuel used. Moreover, it is considered probable that over the next several decades these “upstream” energy costs associated with uranium fuel will increase significantly on a per-unit of fuel basis.
So, did they or didn't they include nuclear as zero emissions, or did they add a fudge factor?
The cynic in me says that the aggregation of "electricity" was in part intended to muddy the issue of nuclear's contrubution. The aside seems to make that argument. While I don't dispute the GHG contribution of uranium mining and processing, I don't see where NYC took the same approach regarding other fuels. IOW, did they tack on an additional 20% to represent the GHG emissions due to petroleum extraction and refining when they accounted for heating and motor fuels and the oil-fired component of electricity production? The report attributes zero GHG emissions to solar, but what about processing the silicon and manufacturing the PV panels?
It seems to me that some environmental dogma has crept into this report.
Lastly, mostly off-topic: How is NYC going to reduce its GHG emissions when they intend to air-condition the platforms on the new Second Avenue subway? Isn't that a luxury that we can't afford under the present circumstances?
The way I read it, they counted nuclear as carbon-free in the final calculations. They simply wanted to make note of the fact they were aware there are complicating factors.
In regards to subway air conditioning, a cost/benefit approach is the way to figure affordability. How much energy does it take to cool an underground station? How many additional riders will the line attract if the stations are air conditioned? And how many vehicle miles will therefore be cut, with follow-on benefits for overall energy efficiency, pollution, and roadway congestion?
Interesting report, but a bit centered around New York. Not surprising, ofcoarse, but a good analysis setting should include a comparison with other parts of the world.
Is NY more CO2 efficient than Tokyo, or Amsterdam, for instance?
Richard,
Not to be sarcastic, but it is a report about NYC. As for comparing NYC's emissions to other cities, I see only London referenced in Figure i. It would be interesting to see the cities outside the US, but it should be presented in some way that normalizes climate.
Apparently, residents of London are more efficient viz. carbon than residents of NYC. I'm curious how much of London's emissions are related to air conditioning. It's a number that's likely to increase, I expect.
Recent reports indicate that if London were to warm up much more (it is currently 12C/20F above normal for April), the subway/underground system would become unusable for the warmer months of the year.
For reasons best explained here it is not considered feasible to cool it.
So, they don't even air-condition the trains in London. I didn't know that.
Just so everyone is clear about NYC, all the trains have air-conditioning. It's a real bear when you're standing on a platform (station) on a hot summer day and the train is pumping out hot air from its AC system, sometimes while the doors are open.
What NYC is considering doing for the 2nd Ave subway is to air-condition the platforms themselves. Where all that waste heat from the trains will go is another question.
I can only speculate how much more attractive an air-conditioned platform would be. I will say that many trains are overcrowded as it is, without the luxury of platform AC. I doubt the incremental increase in passengers would be significant. It would primarily relieve over-crowding on the Lexington Ave lines.
Thanks for highlighting this report, Glenn. I also thought about the energy used in "imported" goods -- a.k.a. the city's environmental footprint. The key question is, how much energy is used to produce the goods consumed by the average New Yorker? Is it significantly more or less than the U.S. average, or about the same?
Because if it's less than the national average or about the same, I don't see what the city can do to affect that. The energy composition of goods has to do with the efficiency of the industrial and agricultural sectors, and the efficiency of the national and international transport sectors.
If the goods the average New Yorker consumes use more energy to produce than the U.S. average, it sure would be interesting to understand how and why that might be.
If I had to guess, I'd say the per capita measure is a little less than U.S. average, just because the average dwelling is a little smaller and holds less stuff. On the other hand, purchasing power may be higher, which might mean more stuff being consumed.
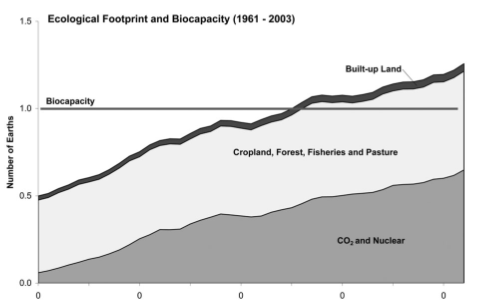
One thing the graphs highlight is how little of the global warming gasses come from vehicles (or gasoline). While New York City is better than average in this regard, I think quite a few people would assume that if we all drove Priuses our problems would be solved. It would help a little, but we still have a huge amount of fossil fuel use in the other sectors.
Nationwide about 31 percent of net greenhouse gas emissions comes from transportation; in New York about 23 percent of greenhouse gas emissions comes from transportation.
Excellent post, and the electricity usage should be split into two categories.
1) Electricity used for Heating and cooling
2) Electricity used for Lighting, computers and other uses.
The point being that we should NOT be using high quality electricity for cooling and heating. It is very wasteful. Heat pumps do a much better job and can be run directly from the sun's heat. It makes no sense to burn fossil fuels to:
You are wasting close to 90% of the fossil fuel. Heat pumps are much more efficient. It is like using incandescent light bulbs vs CF. Solar thermal has a huge growth potential here.
Interesting supposition, but not true. Heating through heat pumps is much more efficient than burning the fuel directly if the temperature outside is not too cold. As for cooling, how praytell do you plan to cool a building by burning fuel without converting this to electrical or mechanical energy first?
Solar heatpumps would be nice, but the highrise buildings pretty much torpedo that idea from the getgo. If you want solar heatpumps then you require suburbia to do it, with all the associated additional costs. I think the curren tradeoff is a good one, NYC uses 1/3 the average of the nation, but no solar heat pumps, sounds fine to me.
1) use nuclear to produce power.
2) Get rid of all nat-gas/oil fired heating. That would slash CO2 by what, 1/3 or so, above and beyond the savings from the electricity section? Not a bad trade off.
Does anyone have a feel for how these numbers compare to an "average western city", ie London, Tokyo, etc..? i realize the absoulte numbers would be different due to differences in population and the like, but with regards to expected changes and the breakdown by sectors.
I've never been to New York.
--
ps. thanks to all the editors for the excellent discussion wrt "water in the gas tank" that has been occurring over the last few weeks.
Please remember that there is zero proof that CO2 levels are actually driving Global warming. There is only conjecture. Supposed concensus doesn't make something true.
Currently there is no physical proof of the CO2 link. Predictions are based on simulations in computers that cannot predict next week's weather, let alone the next El Nino or next drought period. Solar scientists can explain these anomalies and have predicted the last El Nino patterns when CO2 simulations have all failed to.
Remember the press only report the worst case 1% of simulation results that actually have less than 1% likelihood of ever happening. Most likely scenarios are ignored as too boring!
We are all sceptical of Government predictions on Oil production figures, please use the same scepticism on CO2 warming delivered by politicians grasping for more power and control and scientists with their snouts in a multi-billion dollar research funding trough!!
See http://www.lavoisier.com.au/papers/articles/longversionfinal.pdf for more reading.
For what appears to be a scientifically sound counter argument, the results of the last few years worth of climate simulations can be found on page 4 of the IPCC summery http://www.ipcc.ch/pub/spm22-01.pdf
In particular it is concluded that
"anthropogenic warming and cooling influences on climate ... leading to very high confidence that the globally averaged net effect of human activities since 1750 has been one of warming, with a radiative forcing of +1.6 [+0.6 to +2.4] W m-2." (p5)
and
"Average Northern Hemisphere temperatures during the second half of the 20th century were very likely higher
than during any other 50-year period in the last 500 years and likely the highest in at least the past 1300 years." (p10)
"Warmer and fewer cold days and nights over most land areas are virtually certain, Warmer and more frequent hot days and nights over most land areas are virtually certain" (p9)
"The last time the polar regions were significantly warmer
than present for an extended period (about 125,000 years ago), reductions in polar ice volume led to 4 to 6 metres of sea level rise." (p9)
in particular the climate models shown on page 11 show that using current models the observed climate changes can only be re-created by adding forcing terms relating to human induced change.
The final summery is that, under the A1B scenario the expected temperature rise is 2.8c by 2100, with a (5%-95%) uncertainty range of 1.7-4.4c. These models have been able to accurately 'predict' the last 100 years worth of climate, so it is expected that this 'prediction' for the next 100 years is also quite accurate, assuming that the emissions scenario is also correct. (p13 for numbers, p18 for details)
For the results of other emissions scenarios and the details of how these numbers were derived, the document is quite readable to those w/o a scientific background.
I'll leave IPCC bashing to the many scientists who are refusing to let their name be linked to it any longer. Remember the IPCC document is a political statement, not a scientific statement. Remember also that many scientists on both sides of the argument regret the scare mongering going on as it alienates many people.
I'm an engineer and by training and instinct I don't rest until I understand the detail and in this case the science of how CO2 is causing warming. I worried when the only information from alarmists and IPCC was about the story of CO2, no scientific explanation at all. When I did find the science I realised that there is no way CO2 can warm the planet anymore than it has already (which is less than half the observed warming since 1890. Remember we've just come out of a mini-ice age and half the warming at least is a natural cycle from that.
In fact many scientists who examine the science of what little warming CO2 can do rapidly become sceptics. Look at the only temperatures and infra-red frequencies CO2 can actually absorb heat and look at the frequencies for water vapour [the biggest GW gas by far] and see that there are only limited places on this earth where it is physically possible for CO2 to warm the atmosphere. Then read NASA's satellite data and realise that warming isn't happening in these places, then reflect and investigate more.)
I do believe we are approaching a resources meltdown (Oil, water, soil etc) but given the science I simply can't understand how CO2 can cause more than a fraction of the warming that's happened. In fact if the solar scientists are correct (and their science is very credible to me) then we a looking at a cooling period soon and will need all the CO2 we can get to help grow the food we need.
All this talk about extreme climate change is taking the focus away from where we need it, oil depletion, soil and food peaking and more. The biggest game in Project Management is getting the wrong thing right. I worry we are trying to win the wrong game.
Thanks for the reply, and for giving me something to investigate further.
ps.
Is it possible to receive an alert if any of your messages get a reply?
--
the early bird gets the worm but the second mouse gets the cheese
On the mini-ice age recovery, Coby Beck's We are just recovering from the Little Ice Age:
On the scientific credibility of the IPCC, Hayhoe and Dessler's Global warming: Stop arguing and start planning:
It is also one of the mostly highly politicised documents around, remember the political summary came out first. I've seen blogs from scientists (sorry I forgot to add them to favorites so I can't quote their sites here) who when asked to review a paper were refused access to original data by IPCC and the original authors. How can the report be peer reviewed when you can't review the science, only agree or not agree?
The hockey stick was released and widely communicated as fact by the IPCC and it took years for the source data to finally emerge. When it did it was clear that the statistical analysis was heavily flawed and the whole hockey stick findings completely wrong. This happened because IPCC refused access to the original data and refused to make the responsible scientists divulge their data. IPCC is still up to the same tricks, so how can you rate their credibility?
Result is yet another scientist refusing to be part of the IPCC political game. Yes hundreds of scientists contributed, but only a relative handful have control over what gets written. If you review and disagree, it appears that your vote is never published, but you do count as one of the vetting scientists!#@!
Concensus does not a fact make!
I would love links to any site that explains the science (not the story or belief) behind how CO2 causes warming. I need infrared frequencies and temperatures at which CO2 can absorb energy and how they relate to overlapping absorbtion frequencies for water vapor. Please then back this up with actual measurements (satellite data from NASA would be good) that show predicted warming is actually happening.
The only sites that explain the science seem to clearly show CO2 is a very minor contributor. Show me the science! I'm ready to accept arguments either way, but I can't just accept stories from politicians and political scientists. Yes one or two sceptics have been paid $10,000 or so here and there, but governments have paid billions to pro CO2 scientists!
The "Hockey Stick" study and source data have been verified by numerous scientific investigators, including the National Academy of Sciences:
And from Beck's The hockey stick is broken:
Try to learn about global warming and its science here:
http://realclimate.org/
Yep that's one source. Has more information than when I last visited. However, its information conflicts with other sites. In addition it doesn't cover very well (if at all) the effect of overlapping finger frequencies for CO2, water vapor and other gases. It also does not state where warming from CO2 should happen. For example my understanding is that in tropics and most of sub-tropics and even temperate zones water vapor drowns out any effect CO2 can have, leaving only arctic and antarctic as possible areas for CO2 warming. Which part of the atmosphere should be warming and what measurements from an agreed source (such as NASA) support the warming by CO2 theory.
The site like all others does not state what would provide conclusive prrof of warming from CO2 alone. I'm fed up of hearing its global warming when glaciers retreat, advance, shrink in depth, expand in depth, there are king tides (caused by variations in the moon's orbit and nothing whatsoever to do with CO2) and more.
That's one of my problems: no on can agree on the basic science and what would make conclusive proof, least of all professional and extremely experienced climatologists! Concensus? The more I research the more confusing it gets and the less CO2 makes sense.
Models have 1000's of variables. Now if you are 99% certain of the accuracy of each one, a quick play in Excel suggests that once you get more than 527 variables the likelihood of the model being correct is already <1% (99%*99% 527 times) if my very poor statistical skills are right.
I've done a lot of learning and research and no one site I've found has anywhere near all the truth, let alone the stories. I believe Al Gore no more than I believe government or major oil company oil production predictions!